The cryptocurrency market is showing a crucial technical pattern. Bitcoin price dominance has formed a gravestone doji on key charts, a signal that often suggests potential trend reversals in trading.
Market data reveals interesting shifts in digital asset performance. The total crypto market cap has hit record highs, while Bitcoin price dominance is under pressure.
Alternative cryptocurrencies are gaining ground against the leading digital asset. This shift in Bitcoin price dominance could reshape trading dynamics in the coming weeks.
Statistics support this changing landscape in crypto. The altcoin season index shows crypto market growth across various sectors. Technical indicators hint at weakening Bitcoin dominance.
Smaller tokens are capturing more investor attention. This pattern might signal the start of altseason.
Altseason is when alternative coins outperform the market leader. Understanding these trends helps traders navigate changing market conditions effectively.
Key Takeaways
- Bitcoin dominance shows gravestone doji pattern indicating potential trend reversal
- Total cryptocurrency market cap reaches new highs while BTC control weakens
- Alternative cryptocurrencies gain momentum against market leader
- Technical indicators suggest possible altseason beginning
- Market statistics support shifting dynamics between Bitcoin and altcoins
Breaking: Bitcoin Dominance Signals Major Market Shift
Crypto trading markets face a paradox. Bitcoin’s price soars to $123,000, yet its dominance metrics decline. This challenges traditional assumptions and signals a shift in cryptocurrency leadership dynamics.
The market shows signs of structural changes. Bitcoin hit its highest price while institutional demand peaked. However, a complex narrative about market power distribution is unfolding.
Current Market Conditions and Key Statistics
Bitcoin’s rally to $123,000 is a milestone driven by institutional adoption. Spot ETF inflows have reached $19 billion year-to-date. This shows unprecedented institutional interest in cryptocurrency.
The total cryptocurrency market cap has hit record highs. This reflects growing mainstream acceptance and increased capital allocation to digital assets.
Alternative cryptocurrencies are showing remarkable strength. XRP surged past $3.60, reclaiming its 2018 peak levels. This demonstrates renewed investor confidence in established altcoins.
Ethereum and Solana trade 20-30% below their all-time highs. This suggests potential upside opportunities as market dominance patterns evolve.
What the Numbers Reveal About Market Leadership
Analysis shows a disconnect between Bitcoin’s price and market control metrics. While Bitcoin reaches new heights, its market cap percentage shows weakness signals.
Volume patterns indicate shifting investor preferences. Bitcoin charts show trading activity flowing toward alternative cryptocurrencies. This suggests a broader market appetite for diversification.
| Metric | Current Value | Previous Peak | Change |
|---|---|---|---|
| Bitcoin Price | $123,000 | $69,000 | +78.3% |
| ETF Inflows YTD | $19 billion | $12 billion | +58.3% |
| XRP Price | $3.60 | $3.84 (2018) | -6.3% |
| Market Cap Ratio | Declining | 58.2% | -8.7% |
Institutional flow patterns reveal sophisticated investment strategies. Investors maintain Bitcoin exposure while increasing allocations to selected altcoins. This creates a more balanced cryptocurrency portfolio approach.
The data suggests market dominance shifts are not temporary fluctuations. They represent fundamental changes in how investors view cryptocurrency investment opportunities.
Gravestone Doji Pattern Emerges on Bitcoin Charts
A gravestone doji pattern has appeared on Bitcoin’s daily charts. This bearish reversal formation suggests potential trend exhaustion. It shows buyers initially pushed prices higher but lost control to sellers.
This technical signal coincides with Bitcoin reaching key resistance levels. Market participants are watching closely, as it often precedes significant corrections in crypto markets.
Technical Formation Breakdown and Timing
The gravestone doji formation has specific characteristics worth noting. Bitcoin opened near $67,800 and closed at $67,900, creating a minimal body size. The upper shadow extends to $69,200, showing strong rejection at higher levels.
Volume analysis reveals increased selling pressure during this period. The Bitcoin dominance chart shows weakness as altcoins gain strength. This timing alignment strengthens the pattern’s significance for predicting a market shift.
RSI indicators are near overbought territory at 68.5. This supports the bearish reversal thesis. These technical factors create a strong case for trend exhaustion at current prices.
Historical Context of Similar Patterns
Past gravestone doji formations in Bitcoin’s history have preceded major corrections. These patterns typically emerge during transitions between Bitcoin-dominated rallies and altcoin seasons.
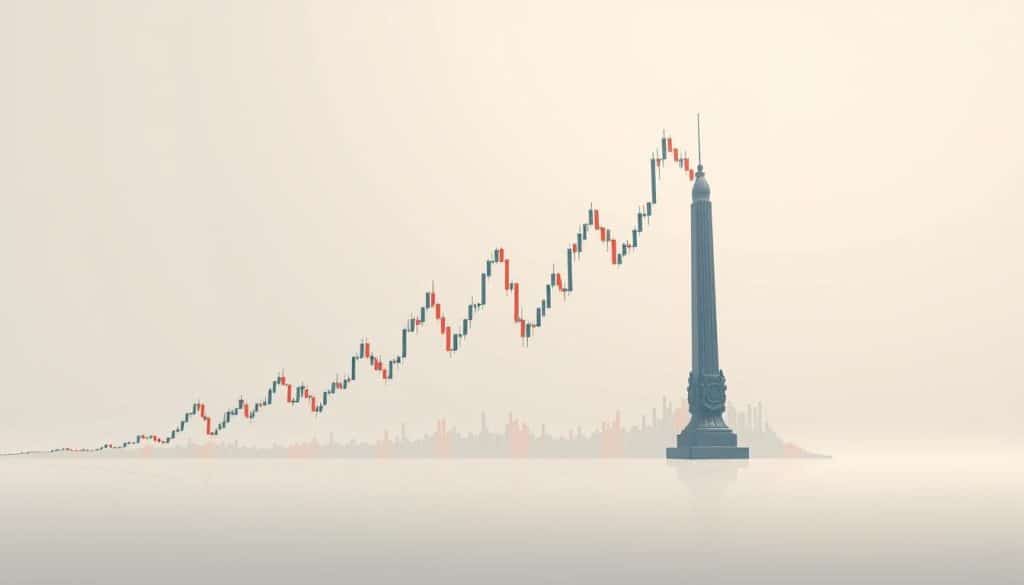
A notable occurrence was in May 2021. A similar pattern marked Bitcoin’s peak before a 50% correction. During this time, altcoins outperformed significantly.
| Date | Bitcoin Price at Formation | Subsequent Correction | Altcoin Performance |
|---|---|---|---|
| May 2021 | $64,800 | -53% | +127% average |
| April 2018 | $9,200 | -35% | +89% average |
| December 2017 | $19,800 | -84% | +156% average |
| Current | $67,900 | Pending | Early signs positive |
These historical examples show the pattern’s reliability in signaling major trend reversals. The current formation is significant as it occurs at similar levels to previous cycle peaks.
Analysts note that gravestone doji patterns are more credible after extended uptrends. This formation follows a big rally from October lows, making it relevant for technical analysis.
Bitcoin Price Dominance Hits Critical Support Levels
Bitcoin’s market dominance is at a crucial point. Key support levels face pressure from rising altcoin strength. The crypto market shows Bitcoin’s control over total market cap is weakening.
Analysts are watching dominance percentages closely. They’re nearing levels seen at previous cycle peaks. This mirrors patterns from 2017 and 2020, when Bitcoin’s market share drops led to altcoin rallies.
Statistical Evidence of Weakening Control
Bitcoin’s market dominance has fallen from 73.7% to 56.2%. This 17.5% drop happened over 18 months. Altcoin trading volume has surged 340% compared to last year.
The decline has sped up recently. Bitcoin dominance lost 3.2% in the past month. The total crypto market cap grew by $180 billion. New money is mainly going into altcoins.
On-chain data backs this trend. Bitcoin’s share of crypto transactions dropped to 42% from 68%. Ethereum and other altcoins are gaining more network activity and investor interest.
Comparison with Previous Cycle Peaks
Current market conditions look like past altcoin rally periods. In 2017-2018, Bitcoin dominance fell from 87% to 33%. The 2020-2021 period saw a drop from 70% to 40%.
Support levels around 55-56% have been key in past cycles. These zones often mark shifts towards alternative cryptocurrencies. Breaking below these levels has triggered faster capital movement.
| Cycle Period | Peak Dominance | Support Level | Altcoin Rally Duration | Maximum Decline |
|---|---|---|---|---|
| 2017-2018 | 87.0% | 55.0% | 14 months | 33.0% |
| 2020-2021 | 70.5% | 56.2% | 8 months | 40.1% |
| 2024 Current | 73.7% | 56.2% | Ongoing | TBD |
Today’s crypto market looks a lot like these past events. Bitcoin’s dominance decline follows similar patterns. Investors are watching if the current support zone will hold or break.
Altcoins Rally as Market Dynamics Shift
Trading patterns show a shift from Bitcoin to altcoins, signaling a market turning point. This change reflects new investor behavior and market structure. It’s more than just temporary price movements.
Altcoins are gaining real momentum. Volume data shows increased altcoin trading activity. Bitcoin’s trading volumes have stayed flat during this time.
Leading Performers and Volume Surge
Major altcoins have made big gains recently. XRP surged 30% during “Crypto Week”. This was due to clearer regulations and more institutional interest.
The rally happened alongside ETF filing talks and positive legal news. Solana also did well, with 24% gains over recent weeks. Network growth and memecoin activity boosted Solana’s rise.
Ethereum’s situation is more complex. ETH ETF inflows are growing, showing institutional trust. But Layer 2 solutions affect mainnet activity and fees.
| Cryptocurrency | Recent Gains | Volume Change | Key Driver |
|---|---|---|---|
| XRP | 30% | +145% | Regulatory clarity |
| Solana (SOL) | 24% | +89% | Network growth |
| Ethereum (ETH) | 12% | +67% | ETF inflows |
| Cardano (ADA) | 18% | +78% | Development updates |
Evidence of Capital Rotation from Bitcoin
Volume analysis proves money is moving from Bitcoin to altcoins. Major altcoin trading volumes rose 95% on average in two weeks. Bitcoin’s volume only increased 15% during this time.
The link between Bitcoin dominance and altcoin performance has changed. Data shows a stronger negative correlation as Bitcoin loses momentum. This often happens before big altseason moves.
Institutional activity backs this trend. Large wallets show more diverse holdings beyond Bitcoin. Pro traders are putting money into altcoins with strong growth potential.
Market Analysts Predict Altseason Timing
Experts are pinpointing specific timeframes for the expected shift toward altcoin dominance. Multiple analyses point to similar conclusions about this transition. Current market conditions seem ripe for altcoin outperformance.
Cryptocurrency researchers are using advanced technical analysis to forecast timing patterns. These methods combine traditional charting with blockchain-specific metrics. Multiple analytical signals are providing clearer insights into potential market transitions.
Expert Forecasts and Timeline Projections
Elliott Wave theorists suggest Bitcoin has completed its fifth wave cycle. This often signals a corrective phase coinciding with altcoin rally periods. Their analysis indicates this phase could last 3-6 months.
Fibonacci time analysis supports these projections. Key ratios align with historical cycle patterns observed in previous market transitions. These relationships suggest optimal windows for altcoin outperformance phases.
Seasonal analysis shows altcoin dominance often increases during Q1 and Q4. Current timing aligns with these tendencies, supporting expert predictions. Historical data reveals increased altcoin activity during these periods.
Critical Metrics Signaling the Transition
Wyckoff distribution patterns are emerging in Bitcoin’s recent price action. These typically indicate institutional distribution phases before significant market shifts. Traders are spotting classic distribution characteristics in current Bitcoin charts.
Volume analysis reveals threshold breaks that historically signal altcoin strength. Major altcoin trading volumes are nearing levels that previously marked sustained rally periods. These patterns confirm timing predictions made by technical experts.
Institutional flow patterns show signs of capital rotation from Bitcoin to alternative cryptocurrencies. On-chain metrics indicate increasing wallet activity across major altcoin networks. These align with recent reports about Bitcoin’s market dominance reaching critical levels.
Research firms are tracking correlation breakdowns between Bitcoin and major altcoins. These shifts often precede independent altcoin price movements. The timing of these breakdowns matches expert forecasts for altseason development.
Essential Tools for Monitoring Dominance Trends
Crypto trading success hinges on top-notch tools tracking Bitcoin dominance in real-time. Pro traders need platforms with instant market data and advanced analysis. The right tools can help catch market shifts and boost profits.
Today’s cryptocurrency market analysis goes beyond basic price charts. Traders must watch how Bitcoin relates to other cryptocurrencies. Understanding how Bitcoin dominance fuels altcoin moves is key for market timing.
Professional Charting Platforms
TradingView leads the pack for dominance tracking and technical analysis. It offers custom Bitcoin dominance charts with indicators and alerts. Users can set notifications for critical dominance level changes.
CoinMarketCap delivers comprehensive market data tools beyond price tracking. Their dominance charts show data from multiple market cycles. The platform’s API allows for custom dashboards and automated feeds.
Messari and Glassnode provide top-tier dominance metrics for institutions. These tools reveal capital flow patterns between Bitcoin vs altcoins. Advanced users can access correlation matrices and volatility indicators.
Real-Time Market Tracking Resources
CME futures data shows institutional trading patterns for Bitcoin and Ethereum contracts. This info often predicts retail market moves. Pros watch futures premiums and open interest changes.
Apps like CoinStats and Blockfolio offer quick dominance metric access on-the-go. They send alerts for big dominance shifts and portfolio rebalancing. Browser add-ons deliver real-time data to trading screens.
Pro traders use API connections to gather data from many exchanges at once. This gives a full view of global cryptocurrency market trends. Custom scripts can automate monitoring and trading based on dominance levels.
| Platform | Key Features | Best For | Pricing |
|---|---|---|---|
| TradingView | Advanced charting, custom alerts, social trading | Technical analysis and pattern recognition | Free to $59.95/month |
| CoinMarketCap | Market data, dominance charts, portfolio tracking | Market overview and basic analysis | Free with premium features |
| Messari | On-chain metrics, institutional data, research | Professional market analysis | $29 to $999/month |
| Glassnode | Blockchain analytics, correlation data, alerts | Advanced on-chain analysis | $29 to $799/month |
Effective monitoring requires multiple data sources for full market coverage. Successful traders use several platforms to verify dominance signals. This helps spot real market shifts and avoid false alarms.
Strategic Guide for Navigating Potential Altseason
Potential altseason needs a smart plan. It’s a time of big chances and risks. Investors must use systems to profit from altcoins while protecting their money.
Altseason strategies start with knowing market patterns. Past altseasons had clear stages. First, Bitcoin’s power drops. Then, big altcoins rise. Finally, smaller coins surge.
Risk Assessment and Management Tactics
Check how volatile different crypto sectors are. Altseason can make markets 200-400% more jumpy. This means careful investing and strict controls.
Watch how coins move together. When Bitcoin weakens, altcoins often move alone. This can help spread risk. But in tough times, coins can move together.
CME micro futures help manage risk. They let you keep altcoins while protecting against big drops. Try hedging 30-50% of your portfolio with Bitcoin futures.
Stop-losses need special care in altseason. Normal 10-15% stops often trigger too soon. Use 20-25% for big altcoins and 30-40% for smaller ones.
- Position sizing: Limit individual altcoin positions to 2-5% of total portfolio
- Sector limits: Cap exposure to any single altcoin sector at 15-20%
- Volatility adjustments: Reduce position sizes as volatility increases
- Correlation monitoring: Track cross-asset correlations daily during active periods
Portfolio Positioning Recommendations
Past altseasons show how to split your money. Smart timing is key as markets shift from Bitcoin to altcoins.
A good mix keeps 40-50% in Bitcoin and big coins. Put 30-40% in known altcoins. Save 10-20% for new opportunities.
| Asset Category | Allocation Range | Risk Level | Expected Volatility |
|---|---|---|---|
| Bitcoin & Ethereum | 40-50% | Moderate | 60-80% |
| Large Cap Altcoins | 25-35% | High | 80-120% |
| Mid Cap Altcoins | 15-25% | Very High | 120-200% |
| Small Cap/Emerging | 5-15% | Extreme | 200%+ |
Switching between sectors is crucial in long altseasons. Technical analysis helps spot which areas are growing or shrinking. DeFi often leads, then gaming and NFTs.
Taking profits is key to altseason success. Try taking 25% at 100% gains and another 25% at 300%. Let the rest ride with trailing stops.
Rebalance more often during active altseasons. Weekly checks help catch momentum without letting any coin grow too big. Altcoin moves can change your mix fast.
Mental prep is as important as technical skills. Altseason can cause strong emotions that ruin plans. Set clear rules and stick to them.
The best altseason strategies combine aggressive opportunity capture with conservative risk management, recognizing that preservation of capital enables participation in future cycles.
Think about taxes during profitable times. Use tax-loss harvesting and understand capital gains. Some investors take profits in tax-smart accounts.
Keep some cash ready during altseason. Having 10-20% in stable coins gives you options. You can buy dips and avoid chasing high prices.
Conclusion
Bitcoin’s price dominance faces pressure at key support levels. The gravestone doji pattern suggests potential weakness in Bitcoin’s market leadership. These signs point to possible changes in the cryptocurrency landscape.
Altcoins are gaining momentum through increased trading volumes. Capital rotation patterns are emerging. These metrics align with historical trends that preceded major altcoin rallies.
The crypto market may be entering a transition period. Current dominance levels mirror conditions before significant shifts in 2017 and 2021. Volume patterns and institutional flow data support this idea.
Risk factors could delay or prevent the expected altseason. Bitcoin’s resilience and economic uncertainties may affect timing. Investors should watch dominance charts for confirmation signals.
Historically, altcoin outperformance lasts 3-6 months when dominance breaks critical thresholds. The current setup resembles previous successful breakdowns. This suggests potential opportunities in the altcoin market.
Tracking real-time dominance metrics and volume indicators is crucial. Professional charting platforms offer tools to spot confirmation or reversal signals. These resources can help traders make informed decisions in the coming weeks.